


IF YOU WERE ASKED to assess an orthokeratology (ortho-k) lens fit using only one piece of data, what would you choose? Topography provides more information about ortho-k lens performance than any other metric. It reveals how the lens behaves in a closed-eye environment and provides insight into centration, overall power effect, and treatment zone size relative to pupil diameter.
Tangential vs Axial Maps
Clinicians often review axial maps first because they feel familiar and intuitive. They smooth curvature data, which helps in assessing the overall refractive pattern of the cornea. But, when fitting ortho-k lenses, understanding the difference between axial and tangential maps is critical (Figure 1).
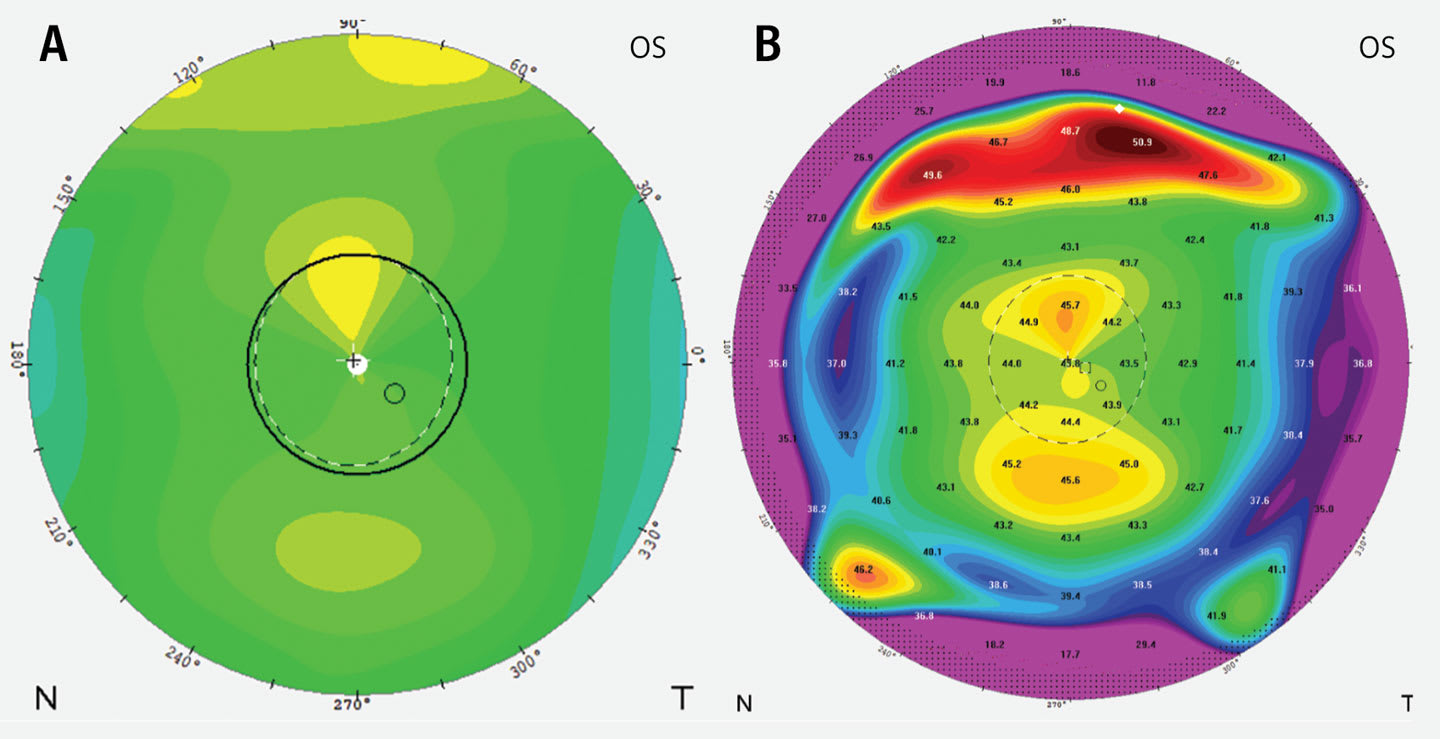
Tangential maps display localized curvature changes and provide clearer information about treatment zone size, shape, and location. These details are essential when evaluating lens centration and mechanical fit.
Clinical Pearl: Use tangential maps to evaluate lens fit. Use axial maps to assess power change and overall optical quality.
The Power of Difference Maps
Difference maps are crucial to evaluating treatment at follow-up visits. They show how the cornea has changed between visits and help clinicians assess treatment stability and progression.
Axial difference maps demonstrate the magnitude of corneal power change at the visual axis and correlate well with changes in spherical equivalent. Tangential difference maps highlight the characteristic red power ring, which helps determine centration and treatment zone size, which should be evaluated relative to pupil size. Smaller treatment zones are often associated with stronger myopia-control effects, particularly in younger patients, whose myopia progresses more quickly (Gong et al, 2024).
Clinical Pearl: As patients enter their teenage years, consider increasing treatment zone size if needed to reduce glare and flare during nighttime activities such as driving.
Decentration Clues
Treatment zone decentration provides important clues about lens fit. Inferior decentration often indicates excessive sagittal height or a lens fitting too tightly. Superior decentration may suggest insufficient sagittal height. Horizontal decentration can indicate asymmetric corneal elevation or the need for toric peripheral curves.
Elevation maps help identify the location of the corneal apex. When the apex is displaced inferiorly, the lens frequently decenters in the same direction. Even small amounts of decentration can result in ghosting or flare, particularly under mesopic conditions.
Clinical Pearl: Not all decentration requires correction. If vision is clear, symptoms are minimal, and corneal health is stable, observation may be appropriate. Notably, treatment zone decentration may enhance myopia control (Wang and Yang, 2019), possibly due to increased ocular wavefront aberrations (Hiraoka et al, 2015).
From Maps to Management
When troubleshooting, address mechanical fit issues before attempting optical changes. Mastery of map interpretation improves troubleshooting efficiency and strengthens clinical confidence.
References
1. Gong G, Zhang BN, Guo T, et al. Efficacy of orthokeratology lens with the modified small treatment zone on myopia progression and visual quality: a randomized clinical trial. Eye Vis (Lond). 2024;11(1):35. doi:10.1186/s40662-024-00403-3
2. Wang A, Yang C. Influence of overnight orthokeratology lens treatment zone decentration on myopia progression. J Ophthalmol. 2019;2019:2596953. doi:10.1155/2019/2596953
3. Hiraoka T, Kakita T, Okamoto F, Oshika T. Influence of ocular wavefront aberrations on axial length elongation in myopic children treated with overnight orthokeratology. Ophthalmology. 2015;122(1):93-100. doi:10.1016/j.ophtha.2014.07.042